
Quick Links:
Installation Of AWS CloudWatch Agent - Manual
Installation Of AWS CloudWatch Agent - Systems Manager
Monitoring; It’s that all-important component of a SysOps engineer’s core competencies. Monitoring assists in troubleshooting multi-component failures and assist in the effort to ensure uptime and reliability of your platform. When running your platform in the cloud, the out-of-box monitoring options will only get you that far… Ok, let’s fill that last sentence in with some more specific variables. When running your platform in AWS, the standard CloudWatch metrics don’t necessarily cover all the bases when it comes to your EC2 instances or the applications that run on top of them.
Depending on your requirements you will want to monitor at least the EC2’s CPU utilization, disk performance, memory utilization, disk space and maybe some application-level logs as well.
Quick Recap: What Is CloudWatch Used For?
CloudWatch is:
- a monitoring service for your AWS resources and applications.
- It collects and tracks metrics.
- We can also collect application log files, which are heavily customizable.
- But it’s power really lies in the alarms and notifications we can create based on these metrics and logs collected.
- CloudWatch integrates into a vast array of AWS services.
Monitoring Your EC2 Instances
By default, if you spin up an EC2 instance, AWS provides some basic metrics of your instance for some visibility. AWS queries their hypervisors for these metrics. It’s these hypervisors that are hosting your EC2 instances, and the metrics are sent to CloudWatch for you to view via the CloudWatch console (also visible from the EC2 console - Instances - Select Instance - Monitoring Tab). The hypervisor only exposes certain metrics, and the rest is up to your OS to supply. It’s stated in the shared responsibility model, that the OS is the user’s responsibility as AWS (the hypervisor) doesn’t have access to your operating system. The metrics that the hypervisor have access to, (i.e. the metrics available for an EC2 instance out-of-the-box) are the following:
- CPU Utilization
- Network Utilization
- Disk Performance
- Disk Reads/Writes
OK, what about the rest? How do we get logs, disk space, or memory utilization into CloudWatch?
There are a few popular methods to achieve this. We can either go with the AWS CloudWatch Agent, or we can opt for custom daemon scripts. AWS does recommend that you use the CloudWatch agent to collect metrics and logs, and custom daemon scripts are seen as somewhat legacy. Also, the script option will require separate scripts for Linux and Windows instances, so that’s something else to keep in mind.
If you have requirements to build custom daemon scripts to a unique use-case, feel free to build on the existing scripts that Amazon provide. A detailed how-to is available here.
In this tutorial we’ll be running through the installation and testing process of CloudWatch agent on an Amazon Linux EC2 instance. We can do the same steps in this guide for any RPM based operating system (CentOS, Red Hat, Amazon Linux). It is also possible to install the CloudWatch agent via AWS Systems Manager (SSM), but first we’ll be diving into the manual way.
We’re definitely not going to follow this process for each and every instance we’re deploying into our environment. After successful installation and configuration of the agent, we can bake this into our golden image, and all new instances will have the agent already installed and configured. If you have a large existing environment that you wish to deploy CloudWatch agent to, or you’re rolling this out to multiple new instances, SSM would be the preferred method of installing the agent. More on SSM in a bit.
Installation Of AWS CloudWatch Agent - Manual
The cool thing about the CloudWatch Agent is that it runs on any Windows and Linux systems, so it is not limited to only the instances hosted in AWS. You can run this on your on-prem servers as well and have a central place (CloudWatch) to view all your logs and metrics, for your entire environment.
What do we need?
- IAM Role - With CloudWatchAgentServerPolicy policy added.
- An Amazon Linux EC2 instance with the IAM Role attached and outbound internet access.
- A Security Group - With SSH allowed. We’re also going to allow HTTP, but this is for the log streaming portion, not strictly required for CloudWatch Agent.
- SSH access to the instance.
If you understand all of the above, or already have this in place, and you would like to jump ahead, feel free to skip the next section and proceed with the installation of the CloudWatch agent.
IAM Role
-
Getting started we’ll navigate to the IAM console, and in the left navigation bar, we’ll select ‘Role’, and then ‘Create Role’.
-
In the next window, under ‘Common use cases’, we’ll select EC2, and click ‘Next’.
-
On the ‘Attach permissions policies’ page that opens, search for ‘CloudWatchAgentServerPolicy’, and select the tick box next to it to select it, and click ‘Next’.
-
You can give it a tag if you like, but I’m going to skip this step for demonstration purposes. On the next screen, give your role a name, and click ‘Create Role’.
The policy we attached to our role, is outlined below. Essentially, it allows your EC2 instance to create logs, a log group, upload metrics and describe some EC2 variables - you know, all the fun stuff…
{
    "Version": "2012-10-17",
    "Statement": [
        {
            "Effect": "Allow",
            "Action": [
                "cloudwatch:PutMetricData",
                "ec2:DescribeVolumes",
                "ec2:DescribeTags",
                "logs:PutLogEvents",
                "logs:DescribeLogStreams",
                "logs:DescribeLogGroups",
                "logs:CreateLogStream",
                "logs:CreateLogGroup"
            ],
            "Resource": "*"
        },
        {
            "Effect": "Allow",
            "Action": [
                "ssm:GetParameter"
            ],
            "Resource": "arn:aws:ssm:*:*:parameter/AmazonCloudWatch-*"
        }
    ]
}
With the IAM Role created we can continue to launch our EC2 instance.
Launch EC2
-
Navigate to the EC2 console, and click ‘Launch instance’, and select your choice of operating system, and size. I’ve gone for the basic, “Amazon Linux 2 AMI (HVM), SSD Volume Type”, and selected t2.micro (on the next page).
-
On the ‘Configure Instance Details’ page, ensure that your instance is placed in the right subnet, and ensure the auto-assign public IP option is correct based on your environment. If the instance is not automatically assigned a public IP, ensure that you are able to get to it, via a jump-host for example. Ensure that you have selected your IAM Role that you created in the previous step (IAM Role).
-
Add storage and tags based on your requirements
-
‘Configure Security Group’ - ensure you have added SSH (port 22) and HTTP (port 80) to your security group. Port 80 is not required for additional system monitoring. I’ll be hosting a small website on my EC2 instance and CloudWatch Agent will be gathering the logs from the application. This security group rule is to allow traffic to the system on port 80.
-
Ensure you have access to the security key that you use when deploying your instance. If you don’t have an existing key, you can create one at this point.
SSH To Our Instance
-
Wait for your instance to boot up and grab the public that gets associated. Or connect via your jump-host.
-
SSH to your EC2 instance using the key pair associated with it.
The command will look like the following: ssh -i <pathToKeyFile> ec2-user@<publicIP>
We are ready to start installing and configuring our CloudWatch Agent.
Manually Installing CloudWatch Agent on Linux EC2
We’ll use the ‘wget’ command to download the RPM file to our Amazon Linux EC2 instance. We can do this straight from the command-line. This, of course, assumes that the instance has a route out to the internet. Either via NAT Gateway or Internet Gateway. The installation file is hosted by AWS, and you can download it to the instance.
Note that there are other versions available depending on your operating system. Full list available here.
$ wget https://s3.amazonaws.com/amazoncloudwatch-agent/amazon_linux/amd64/latest/amazon-cloudwatch-agent.rpm
Connecting to s3.amazonaws.com (s3.amazonaws.com)|52.216.112.101|:443... connected.
HTTP request sent, awaiting response... 200 OK
Saving to: 'amazon-cloudwatch-agent.rpm'
If you download it to the current directory, you can run the following command.
$ sudo rpm -U ./amazon-cloudwatch-agent.rpm
create group cwagent, result: 0
create user cwagent, result: 0
With the agent installed, we can configure it with the config wizard; found at: /opt/aws/amazon-cloudwatch-agent/bin/amazon-cloudwatch-agent-config-wizard. It’s a question-and-answer type configuration tool, and you can execute it with sudo privileges, as follows:
$ sudo /opt/aws/amazon-cloudwatch-agent/bin/amazon-cloudwatch-agent-config-wizard
=============================================================
= Welcome to the AWS CloudWatch Agent Configuration Manager =
=============================================================
On which OS are you planning to use the agent?
1. linux
2. windows
default choice: [1]:
Answer the questions based on your environment. For me, I stuck to default options, except for:
- Turn on StatsD -> No
- Monitor metrics from CollectD -> No
- Which default metrics config do you want? -> 2-Standard
- If needed, select No when prompted to monitor log files. Log files are covered below.
The wizard saves the configuration file that it builds in the following location: /opt/aws/amazon-cloudwatch-agent/bin/config.json. Once configured we can go ahead and start the agent service, and pass the configuration file with -c flag. Adding the -s will restart the service.
$ sudo /opt/aws/amazon-cloudwatch-agent/bin/amazon-cloudwatch-agent-ctl -a fetch-config -m ec2 -c file:/opt/aws/amazon-cloudwatch-agent/bin/config.json -s
We can also use systemd to check the status of the service:
$ sudo systemctl status amazon-cloudwatch-agent.service
 amazon-cloudwatch-agent.service - Amazon CloudWatch Agent
   Loaded: loaded (/etc/systemd/system/amazon-cloudwatch-agent.service; enabled; vendor preset: disabled)
   Active: active (running) since Thu 2020-03-05 12:44:08 UTC; 45s ago
 Main PID: 3907 (amazon-cloudwat)
   CGroup: /system.slice/amazon-cloudwatch-agent.service
           └─3907 /opt/aws/amazon-cloudwatch-agent/bin/amazon-cloudwatch-agent -config /opt/aws/amazon-cloudwatch-agent/etc/amazon-cloudwatch-agent.toml -pidfile /opt/aws/amazon-cloudwatch-agent/var/am...

Mar 05 12:44:08 ip-10-0-1-140.ec2.internal systemd[1]: Started Amazon CloudWatch Agent.
Mar 05 12:44:08 ip-10-0-1-140.ec2.internal systemd[1]: Starting Amazon CloudWatch Agent...
Mar 05 12:44:08 ip-10-0-1-140.ec2.internal start-amazon-cloudwatch-agent[3907]: /opt/aws/amazon-cloudwatch-agent/etc/amazon-cloudwatch-agent.json does not exist or cannot read. Skipping it.
Mar 05 12:44:08 ip-10-0-1-140.ec2.internal start-amazon-cloudwatch-agent[3907]: Valid Json input schema.
Mar 05 12:44:08 ip-10-0-1-140.ec2.internal start-amazon-cloudwatch-agent[3907]: I! Detecting runasuser...
Mar 05 12:44:08 ip-10-0-1-140.ec2.internal start-amazon-cloudwatch-agent[3907]: 2020/03/05 12:44:08 I! AmazonCloudWatchAgent Version 1.237768.0.
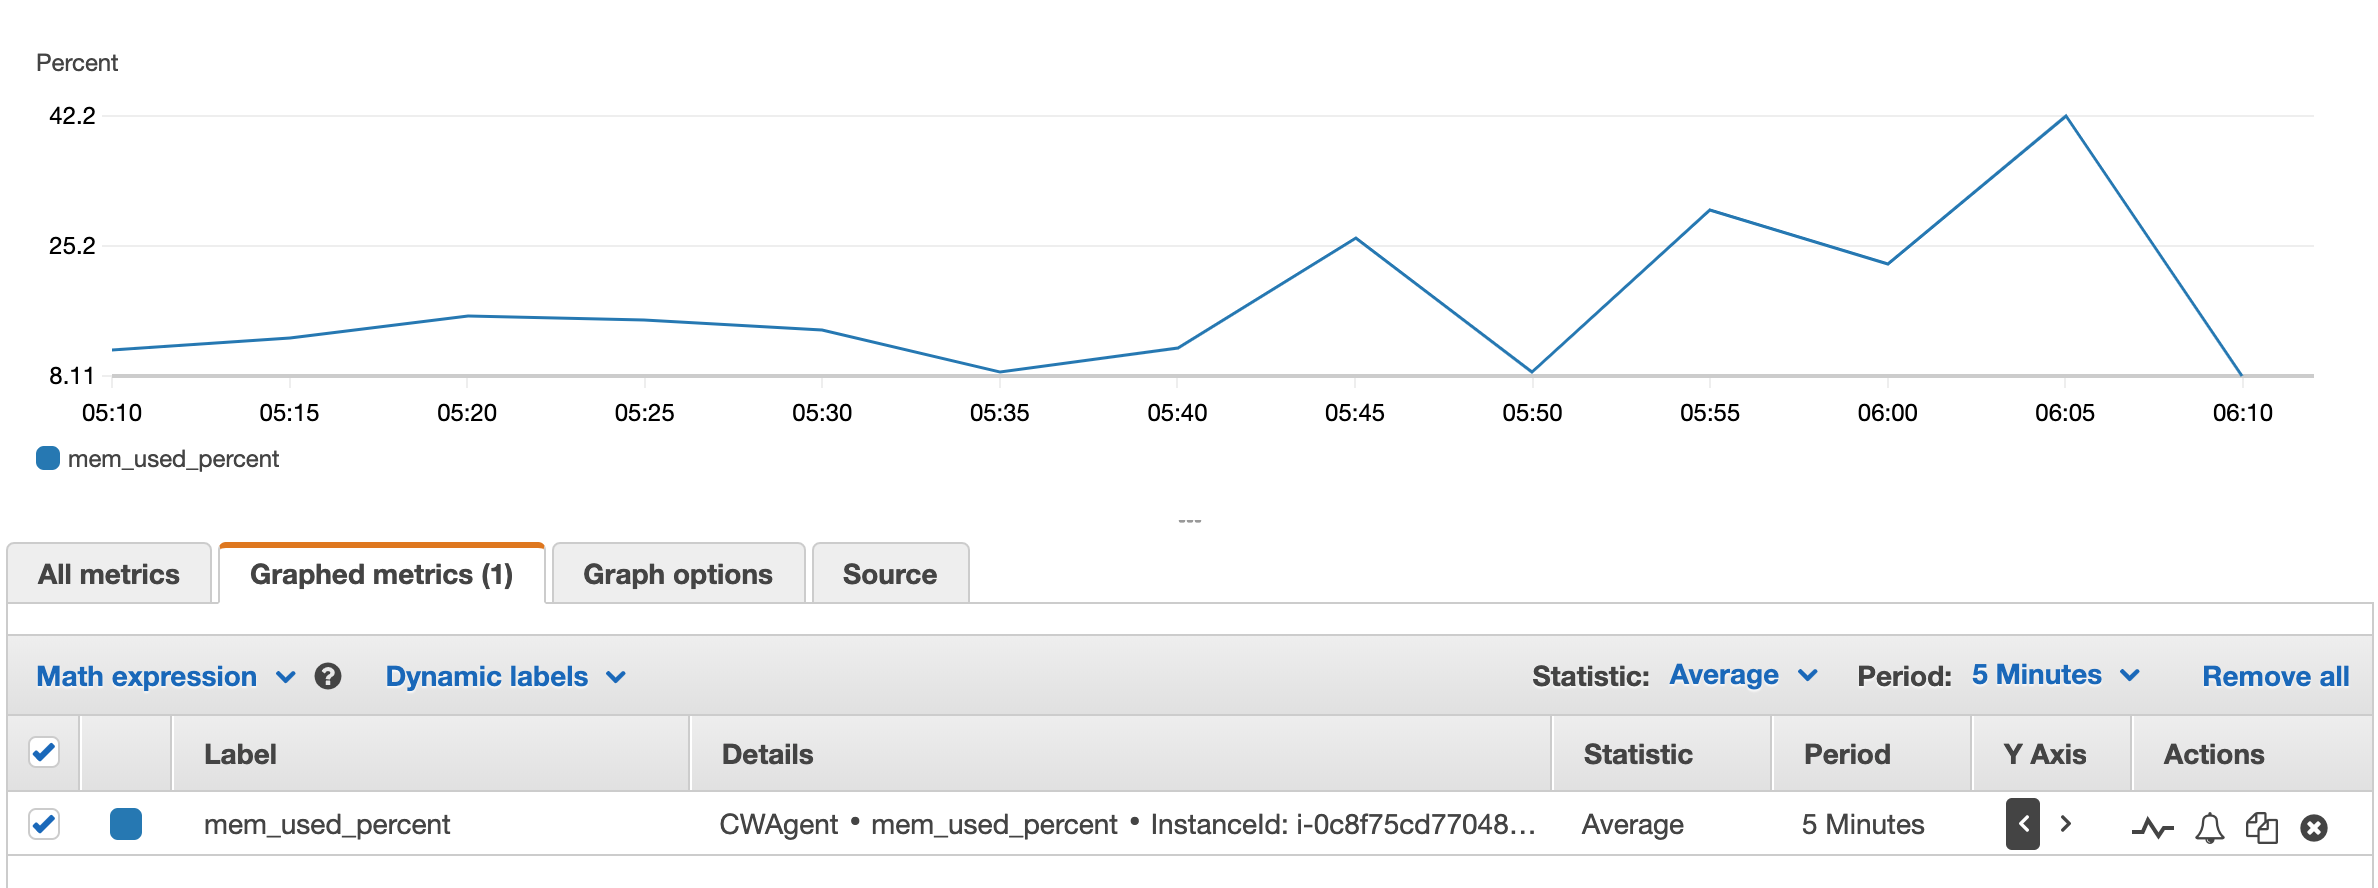
Now that the agent is configured and started, we will be able to see the memory, swap and disk metrics in CloudWatch console.
From the CloudWatch console, select the ‘Metrics’ option in the left navigation pane. On the ‘All Metrics’ tab, a new grouping under call ‘CWAgent’ should be listed. If this grouping is not shown, there could be a configuration issue with the agent, or the agent service is not started.
Drilling down into the CWAgent group; You can browse around for the metrics you require. I found the memory metrics under the ‘ImageId, InstanceId, InstanceType’ grouping.
Testing Some Memory Reporting
I was able to generate some more interesting memory metrics by utilizing the ‘stress’ application.
To install ‘stress’ on your Amazon EC2 you can enable the EPEL repo, and install stress using yum:
$ sudo amazon-linux-extras install epel -y

$ sudo yum install stress -y
With ‘stress’ installed we can create a pretty cool test, and increase the stress with every loop. NOTE: Do NOT perform the following on a production instance.
$ X=64; Y=30; while true; do stress -c 2 -i 1 -m 2 --vm-bytes "$X"M -t "$Y"s; sleep $Y; X=$(expr $X + 64); Y=$(expr $Y + 30); echo "Values for next run:" $X $Y; done

stress: info: [818] dispatching hogs: 2 cpu, 1 io, 2 vm, 0 hdd
stress: info: [818] successful run completed in 30s
Values for next run: 128 60
stress: info: [878] dispatching hogs: 2 cpu, 1 io, 2 vm, 0 hdd
stress: info: [878] successful run completed in 60s
Values for next run: 192 90
stress: info: [985] dispatching hogs: 2 cpu, 1 io, 2 vm, 0 hdd
stress: info: [985] successful run completed in 90s
Values for next run: 256 120
stress: info: [1179] dispatching hogs: 2 cpu, 1 io, 2 vm, 0 hdd
stress: info: [1179] successful run completed in 120s
Values for next run: 320 150
stress: info: [1399] dispatching hogs: 2 cpu, 1 io, 2 vm, 0 hdd
stress: info: [1399] successful run completed in 150s
Values for next run: 384 180
stress: info: [1653] dispatching hogs: 2 cpu, 1 io, 2 vm, 0 hdd
stress: info: [1653] successful run completed in 180s
Running the above for a few minutes we get a pretty little graph in CloudWatch:
Logs
In the case that we want to push all our web server’s log files to CloudWatch, so we have a central place to view them we can use the Logs functionality within the CloudWatch agent. When prompted for log file config using the wizard, it was completed as follows:
Do you want to monitor any log files?
1. yes
2. no
default choice: [1]:
1
Log file path:
/var/log/httpd/access_log
Log group name:
default choice: [httpd]
httpd-access
Log stream name:
default choice: [{instance_id}]
WEBSERVER-{instance_id}
Do you want to specify any additional log files to monitor?
1. yes
2. no
default choice: [1]:
2
Just one thing to note, the ‘log file path’ is the full path to the access_log file; the agent is unable to monitor a directory and all the files within.
With regards to ‘log stream name’ we can prepend a string (WEBSERVER) to a unique identifier (instance-id), to group certain servers' log files together, to meet naming convention requirements. i.e. By Region, Application, or Owner.
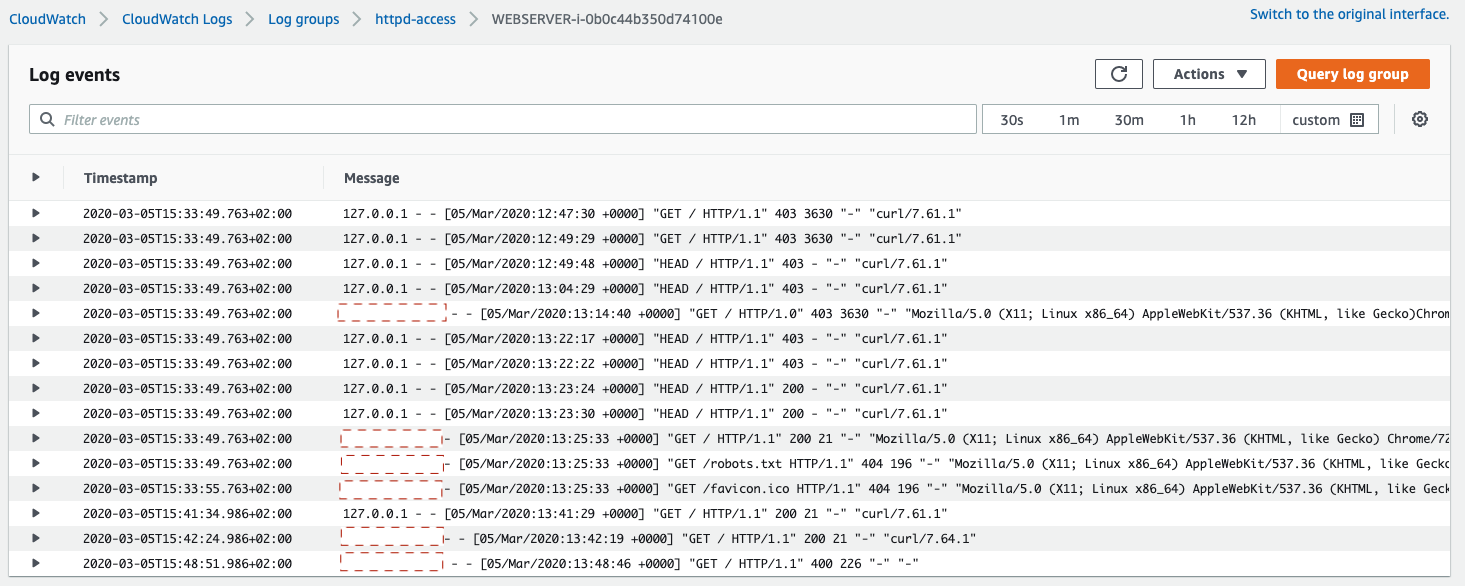
With the agent service started, we are able to view our web servers' access logs in AWS CloudWatch.
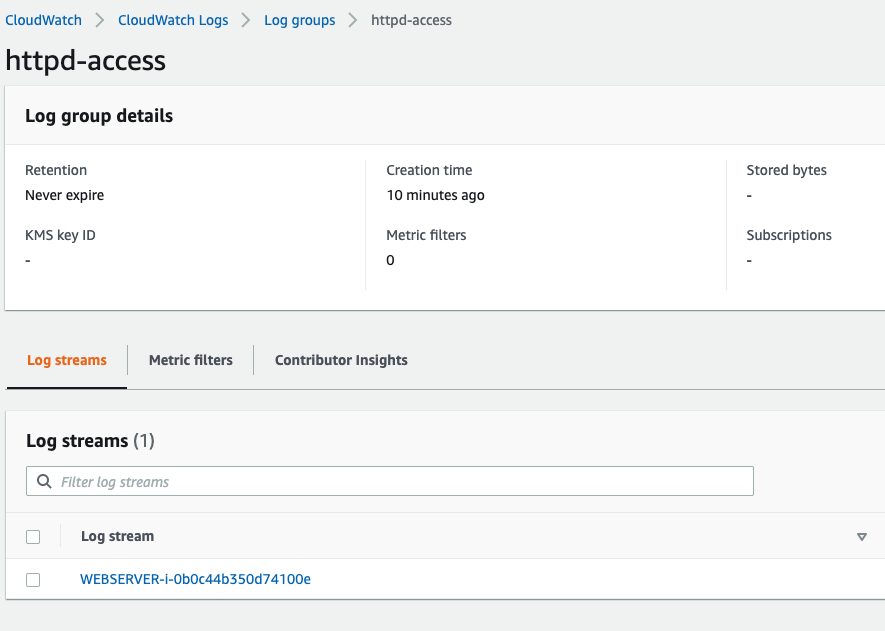
Drilling down we can see the logs per web server:
Installation Of AWS CloudWatch Agent - Systems Manager
Just a quick overview of Systems Manager & SSM Agent
SSM Agent is a little piece of software developed by Amazon that runs on your EC2. The SSM Agent accepts requests from the AWS Systems Manager service, and configures the instance per the requests that was sent. This would enable you to manage your instances without logging into each and every one.
SSM Agent comes preinstalled on a number of AMIs:
- Windows Server 2008-2012 R2 AMIs published in November 2016 or later
- Windows Server 2016 and 2019
- Amazon Linux
- Amazon Linux 2
- Ubuntu Server 16.04
- Ubuntu Server 18.04
- Amazon ECS-Optimized
If your OS of choice is not listed above, you will need to manually install and configure the SSM Agent. If you need help with that; you can follow this guide. These steps can of course be scripted and executed on launch.
What the Systems Manager service enables us to do is publish some configuration files in a central storage location (SSM’s Parameter store). When we roll out an application (in our case; CloudWatch Agent), we can tell it to use the configuration from the parameter store. This ensures that the application is deployed across our environment with the same config.
What do we need?
As with the manual steps, we will need:
- IAM Role - This time, we will need a few additional policies added to allow our SSM service to configure our EC2s:
- CloudWatchAgentServerPolicy
- CloudWatchAgentAdminPolicy
- AmazonSSMManagedInstanceCore
- AmazonSSMDirectoryServiceAccess
- An Amazon Linux EC2 instance with the IAM Role attached and outbound internet access.
- A Security Group allowing SSH (port 22)
NOTE: CloudWatchAgentAdminPolicy, allows your instance to write to the Parameter store, which is quite a powerful permission. It is strongly suggested to only use this policy, if and when you need it.
Let’s jump right in
The process I followed to install CloudWatch agent via SSM is as follows:
- Create our IAM role with all the above policies added
- Launch EC2 with IAM Role attach
- Register EC2 with SSM service, and install CloudWatch agent
- SSH to EC2, run the CloudWatch Agent setup wizard
- Upload configuration file to parameter store
Steps 4 and 5, are only required for the first instance that we deploy. Once the configuration file is stored in SSM’s parameter store we can tell all our instances to download and use the same config from the store.
Continue to launch an EC2. For my instance I added a tag with key=role and value=webserver, I’ll explain why shortly.
Navigate to Systems Manager (SSM) console, and select Quick Start in the navigation pane on the left. On the Quick Start menu, select default role, for Instance Profile and Systems Manager. Scrolling down we see a few options, based on my requirements, all options are selected, if you only want to install and configure CloudWatch agent, that’s fine too.
- Update Systems Manager (SSM) Agent every two weeks
- Collect inventory from your instances every 30 minutes
- Scan instances for missing patches daily
- Install and configure the CloudWatch agent
- Update the CloudWatch agent once every 30 days
The targets section is where my tags come in; You can just manually select your instances, but I prefer to group all the instances together with tags. This also allow for future managed instances to have the same applied - meaning, if we add another instance with the same tags, and roles, our EC2 will have CloudWatch agent automatically installed. Instances are registered with SSM if they have the SSM Agent installed and the correct roles associated. Click ‘Setup Systems Manager’ when you’re ready.
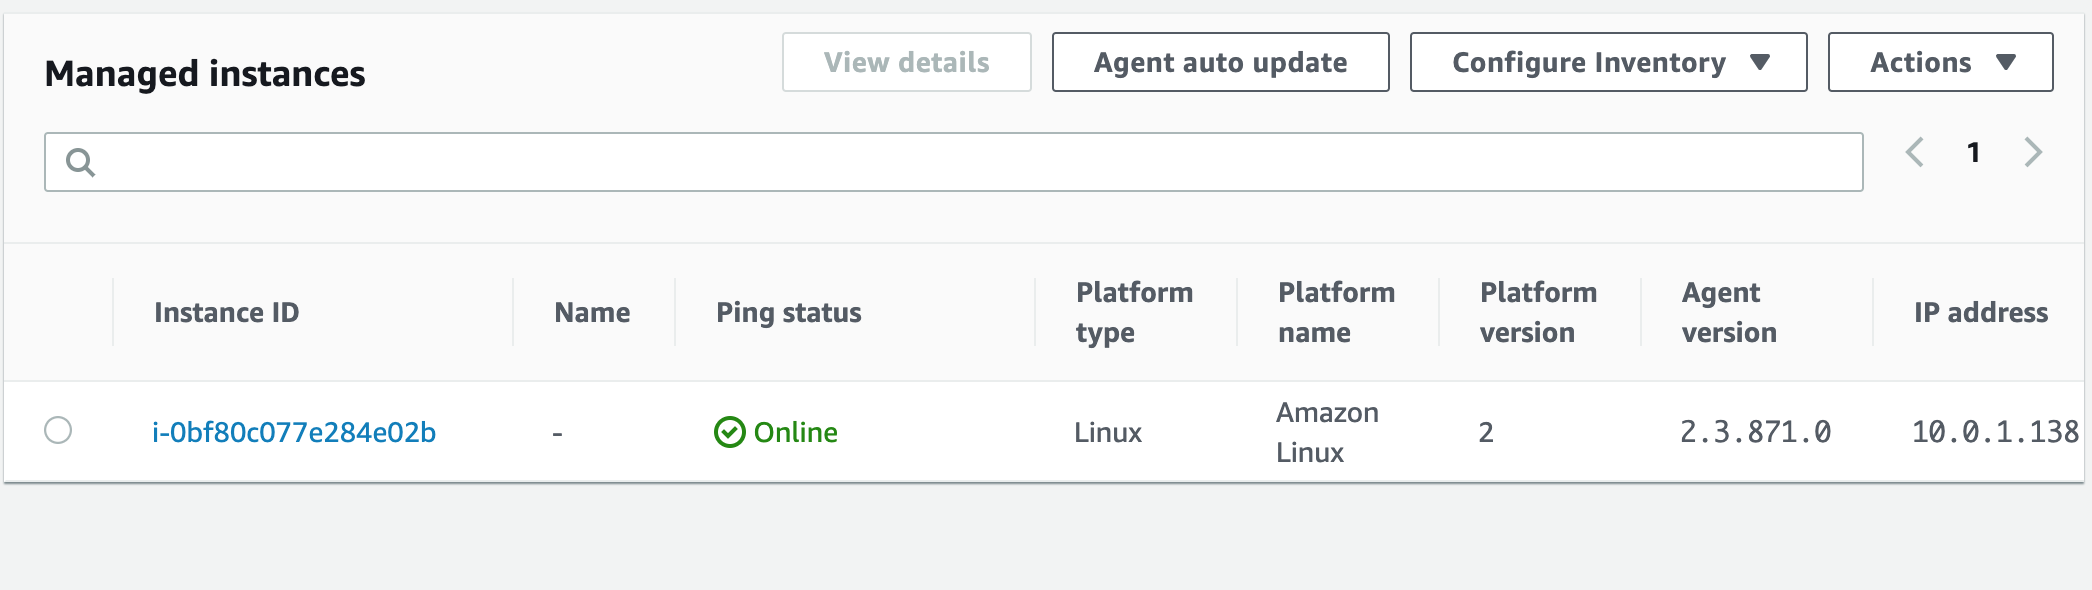
With all the correct permissions added, we can navigate to Managed instances, and see our first EC2 instance listed.
We can now SSH into our EC2, and configure our CloudWatch agent. When executing the wizard, you will be prompted to save the config in the parameter store as per the example below.
NOTE: The config file that is stored in SSM’s parameter store needs to start with ‘AmazonCloudWatch-’.
[...]
Please check the above content of the config.
The config file is also located at /opt/aws/amazon-cloudwatch-agent/bin/config.json.
Edit it manually if needed.
Do you want to store the config in the SSM parameter store?
1. yes
2. no
default choice: [1]:
1
What parameter store name do you want to use to store your config? (Use 'AmazonCloudWatch-' prefix if you use our managed AWS policy)
default choice: [AmazonCloudWatch-linux]
AmazonCloudWatch-LinuxWebServer
Trying to fetch the default region based on ec2 metadata...
Which region do you want to store the config in the parameter store?
default choice: [us-east-1]

Which AWS credential should be used to send json config to parameter store?
1. ZZYYXX889900AABBCCDD(From SDK)
2. Other
default choice: [1]:

Successfully put config to parameter store AmazonCloudWatch-LinxWebServer.
Program exits now.
Reminder that the wizard is at the following location (on Linux): /opt/aws/amazon-cloudwatch-agent/bin/amazon-cloudwatch-agent-config-wizard
Back in the Systems Manager console, we can navigate to the parameter store, and see our CloudWatch Agent config here.
We now have a standard configuration file that we can use to configure all our EC2 instances that are Linux web servers. As with the manual installation, the amazon-cloudwatch-agent service doesn’t apply the configuration after the wizard is run, we need to fetch the config from our parameter store. However, this time we will do it in bulk, tell all our instances to fetch the same config.
Launching a second instance - with the same tags and IAM role - our instances will register with SSM, which we will again see under the Managed Instances section.
Run Command
We will use the ‘Run Command’ feature to tell all our CloudWatch agents, to fetch the configuration in our parameters. In the SSM Console, we can navigate to the ‘Managed Instances’ section, and select the ‘Actions’ drop-down, select ‘Run Command’ from the options available.
In the next window, search for ‘AWS-RunShellScript’, and in the textbox under the Command Parameters section, enter the following:
$ sudo /opt/aws/amazon-cloudwatch-agent/bin/amazon-cloudwatch-agent-ctl -a fetch-config -c ssm:AmazonCloudWatch-LinuxWebServer -s
Note: that the name we gave our configuration file in the parameter store was AmazonCloudWatch-LinuxWebServer, and it’s that name that we use in the command above.
In the targets section, we can specify instance tags, and use our key=role and value=webserver tags to select only certain instances. Click ‘Run’ to execute the command on all our instances.
Conclusion
Not only is CloudWatch an excellent monitoring service, and a must-have tool in every cloud environment, but Systems manager is a very powerful instrument to build automation into the management of your cloud and on-prem workflows.